GT Tabulation
Reading GT (Grand Total, simple) tabulation results, per-question-type breakdowns, and the fraud-flag exclusion toggle.
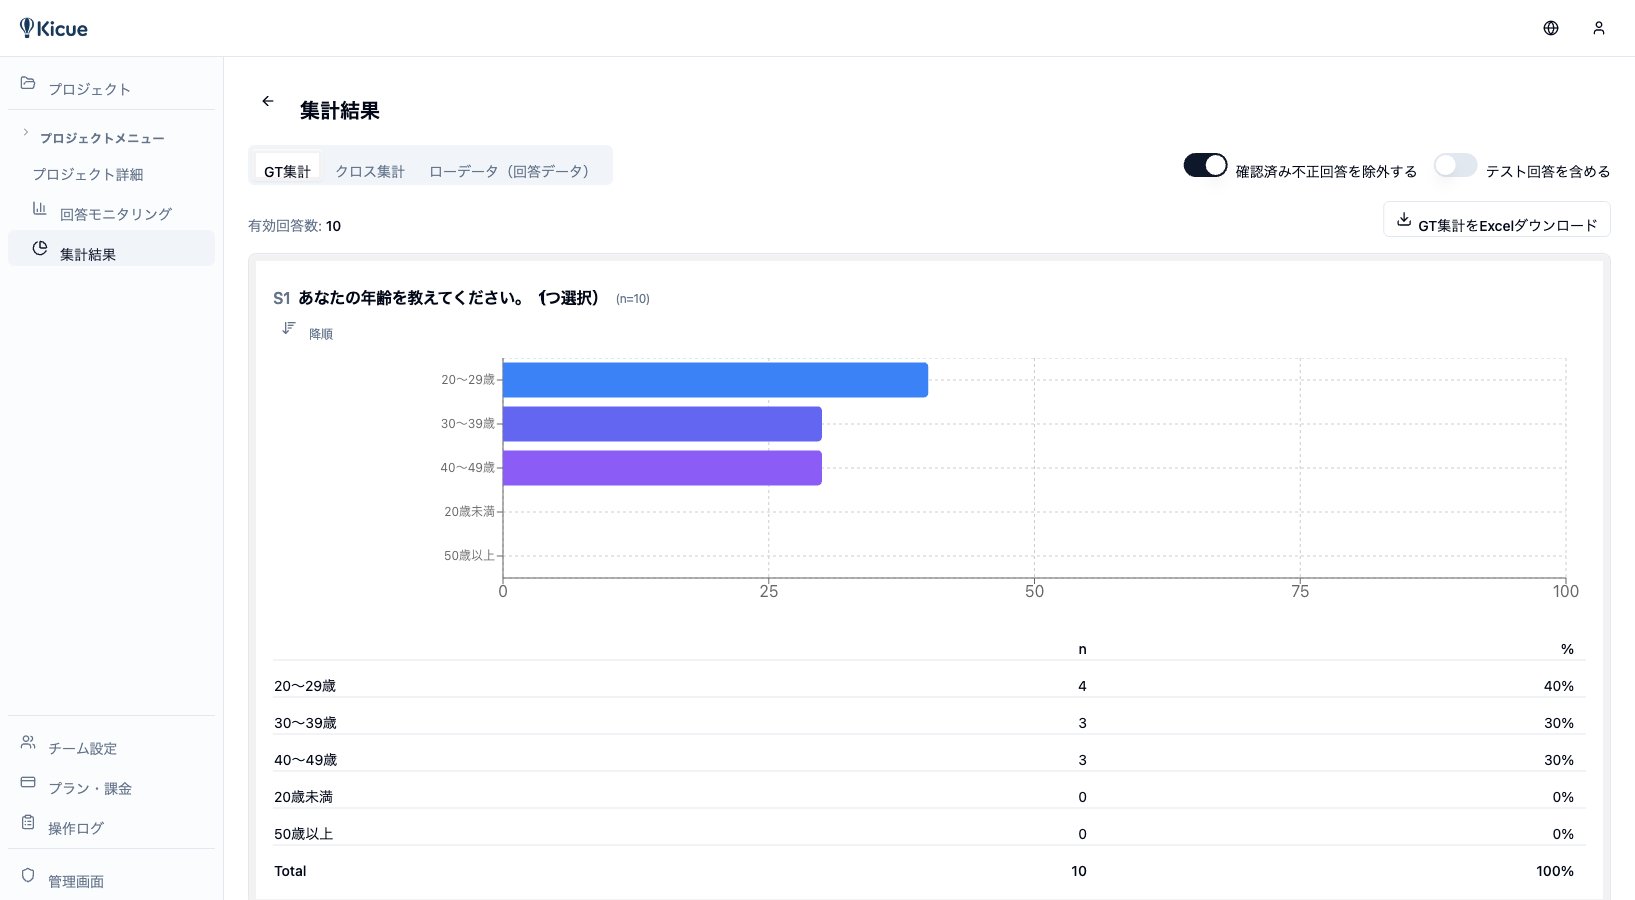
GT tabulation (Grand Total = simple tabulation) summarizes each question by showing how many times each option was selected and the corresponding percentage. It is the most basic form of analysis.
The GT tabulation screen
Open the Analytics tab and select GT tabulation from the sub-menu. A per-question overview appears.
How to read each question type
Single answer (SA)
| Option | Count | % |
|---|---|---|
| Male | 120 | 48.0% |
| Female | 125 | 50.0% |
| Other | 5 | 2.0% |
| Total | 250 | 100% |
Multiple answer (MA)
Totals can exceed 100% because respondents can pick multiple options.
| Option | Count | % |
|---|---|---|
| Coca-Cola | 230 | 92.0% |
| Pepsi | 180 | 72.0% |
| Kirin | 210 | 84.0% |
Matrix
Each row × column cell shows the count and percentage for that combination.
Scale (LIKERT / NPS)
- LIKERT — counts and percentages for each step, plus average and standard deviation
- NPS — promoter / passive / detractor shares plus the calculated NPS score
Numeric input
- Mean, median, min, max, standard deviation
- Histogram view
Fraud-flag exclusion toggle
At the top of the GT tabulation screen is an Exclude fraud flags toggle.
- On (default) — excludes speeders, straight-liners, bots, and similar flagged responses
- Off — includes every response in the tabulation
Use the toggle to compare results with and without the flagged population.
Completion and valid-response counts
The header also shows:
- Total responses — every response, including incompletes
- Completions — responses that reached the end
- Valid responses — completions after fraud exclusion
- Completion rate
Exporting GT results
Every question's tabulation can be downloaded as CSV or Excel. See Export for details.
Next step
For segment-level analysis, use Cross Tabulation.