Response Monitoring
How to track live response progress in kicue, including summary KPIs, time-series charts, fraud flags, and quota progress.
After publishing, open the Monitoring tab to watch response progress in real time. You can observe the state of the field on a single screen and make decisions — pausing the survey, tweaking questions — without leaving kicue.
Monitoring screen layout
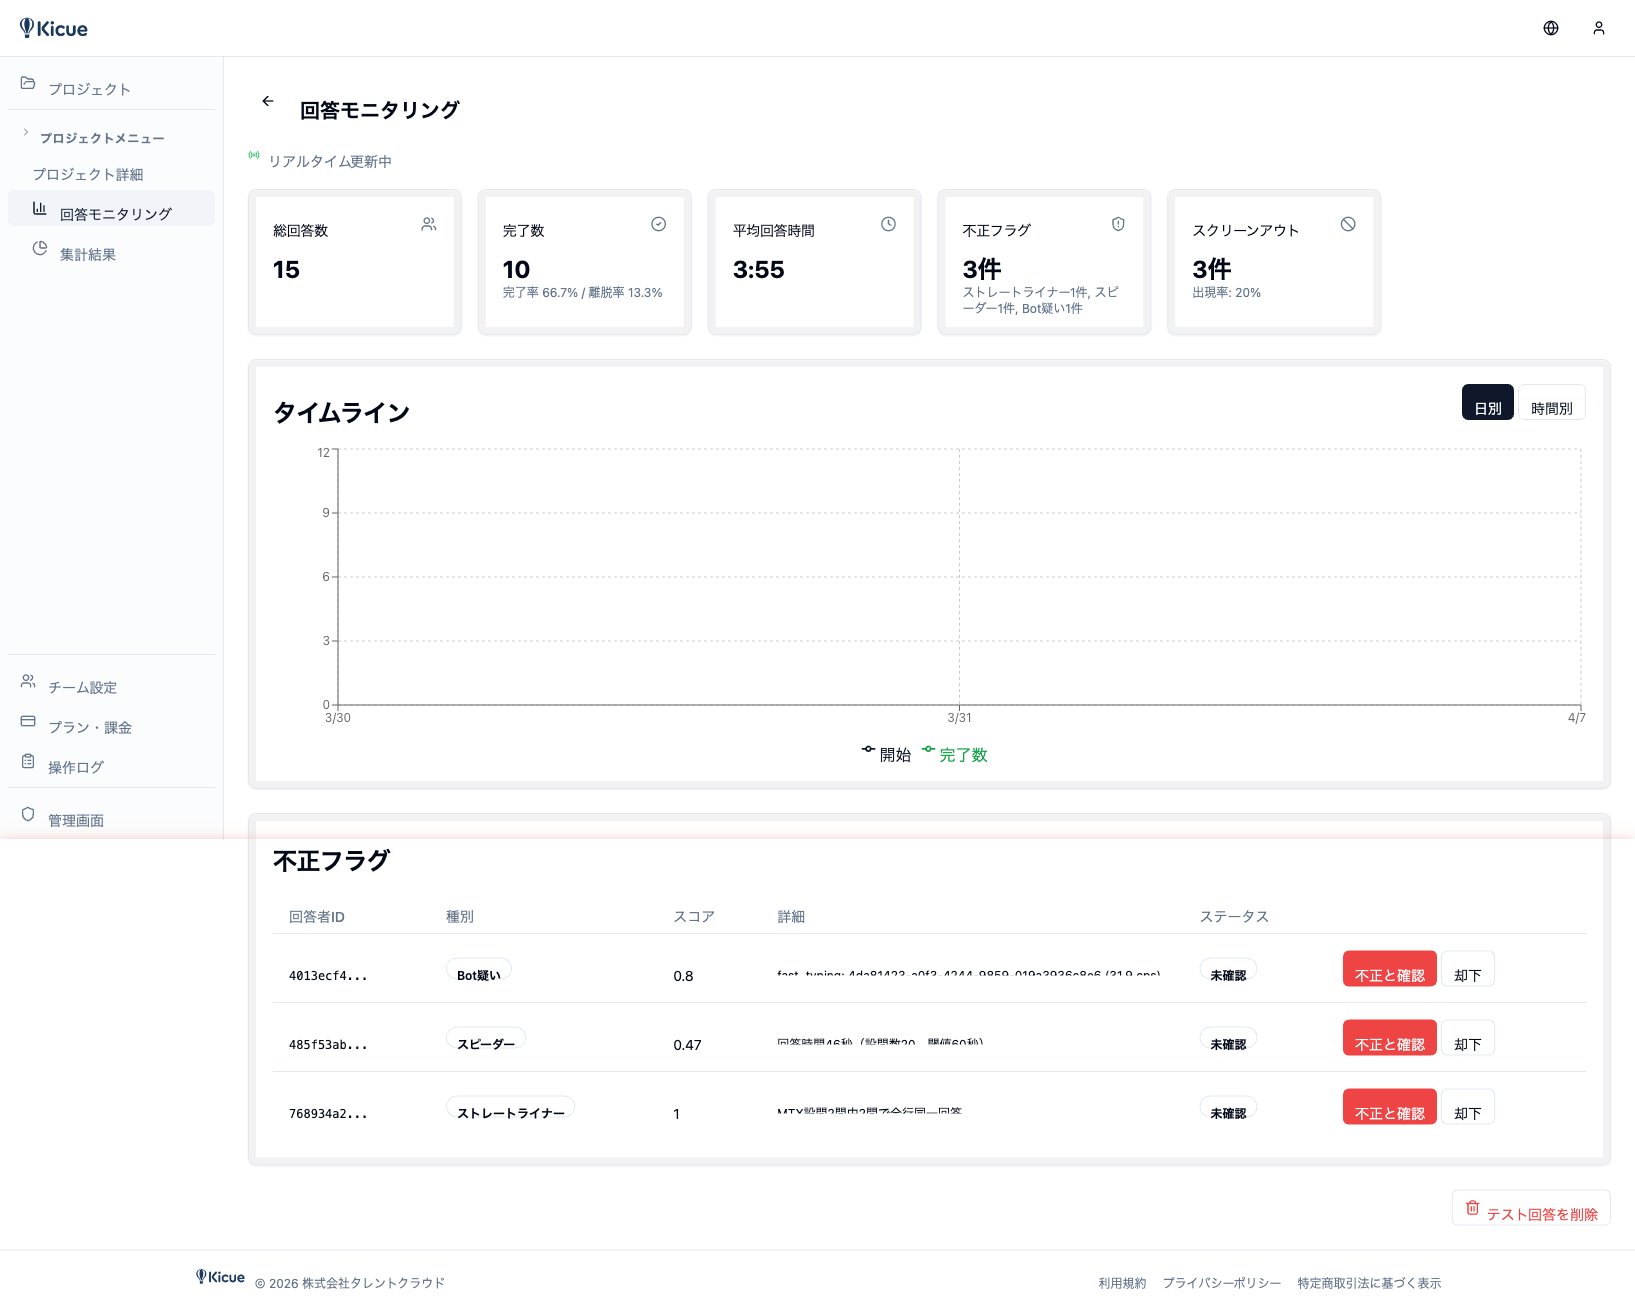
The monitoring screen has four main areas.
- Summary cards — headline KPIs (total responses, completion rate, drop-off rate)
- Time-series chart — responses over time
- Fraud flags — counts for speeders, straight-liners, bots, and AI agents
- Quota progress — per-attribute fill status when quota management is enabled
Summary cards
The top of the screen shows headline KPIs:
| Metric | Description |
|---|---|
| Total responses | All responses from start to cutoff |
| Completions | Responses that reached the end |
| Completion rate | Completions ÷ total responses |
| Drop-off rate | Share of respondents who abandoned midway |
| Average time | Average time to complete |
| Fraud flags | Count of automatically flagged responses |
These metrics update in real time. Keep the browser open and they refresh every few seconds.
Time-series chart
See response counts over time by minute, hour, or day.
- Email-campaign spikes
- Day-of-week and time-of-day patterns
- Ad-spend impact
Great for campaign effectiveness measurement and pacing projections.
Fraud flag inspection
kicue automatically scores response quality and applies flags:
- Speeders — abnormally fast completions
- Straight-liners — respondents who pick the same column across a matrix
- Bots — automation tools
- AI agents — ChatGPT-style automated answering
Flagged responses can be filtered in the list, and aggregation screens provide a toggle to include or exclude them.
Quota progress (with quota management)
When quota management is set up (e.g. 100 males in their 20s, 100 females in their 30s), each demographic segment shows a progress bar.
- Percent full (e.g. 67 / 100)
- Automatic screen-out when a segment is full
- Remaining capacity
Available actions while monitoring
- Pause / resume the survey
- Filter by fraud flags
- Drill into an individual response to see the full answer set
- Interim CSV download for an in-flight data snapshot
Next step
Once you have enough responses, move on to GT Tabulation and Cross Tabulation for analysis.